The August Market Read: Rates Drift, Applications Cool, and Equity Keeps Doing the Heavy Lifting
Every week, we track the full picture of the U.S. mortgage market — live rates, application demand, and actual funded loan volume — so our lenders can make marketing decisions based on what borrowers are really doing, not what headlines say they might do. Here's what the data is telling us as we close out August.
Rates: Holding in a Tight, Elevated Band
The 30-year fixed (Freddie Mac PMMS) sits at 6.65%, having traded in a 6.30%–6.89% range over the past several months. Daily market pricing (Mortgage News Daily) puts the 30-year at 6.77%, and the MBA's effective 30-year rate came in at 6.96%, up about 7 basis points on the week.
The takeaway: no relief rally, but no spike either. We remain in the environment that has defined 2026 — rates high enough to keep rate-and-term refinances selective, but stable enough that borrowers have stopped waiting for a miracle. That psychological shift matters more than the rate itself.
Applications: A Cooling Week Across the Board
The MBA Weekly Applications Survey showed demand pulling back across every category:
- Total applications: down ~6% week over week
- Purchase applications: down ~3%
- Refinance applications: down ~9.9% (down 13% vs. four weeks ago)
- Conventional refi applications: down 7.7% on the week — but still up 3% year over year
- Government applications: down ~13.7%, the steepest decline of any category
One week doesn't make a trend, and late-August seasonality plays a role. But the composition is the story: conventional refi demand is proving more durable than government demand, and it's the only major category still positive against last year.
Funded Loans: Where the Volume Actually Is
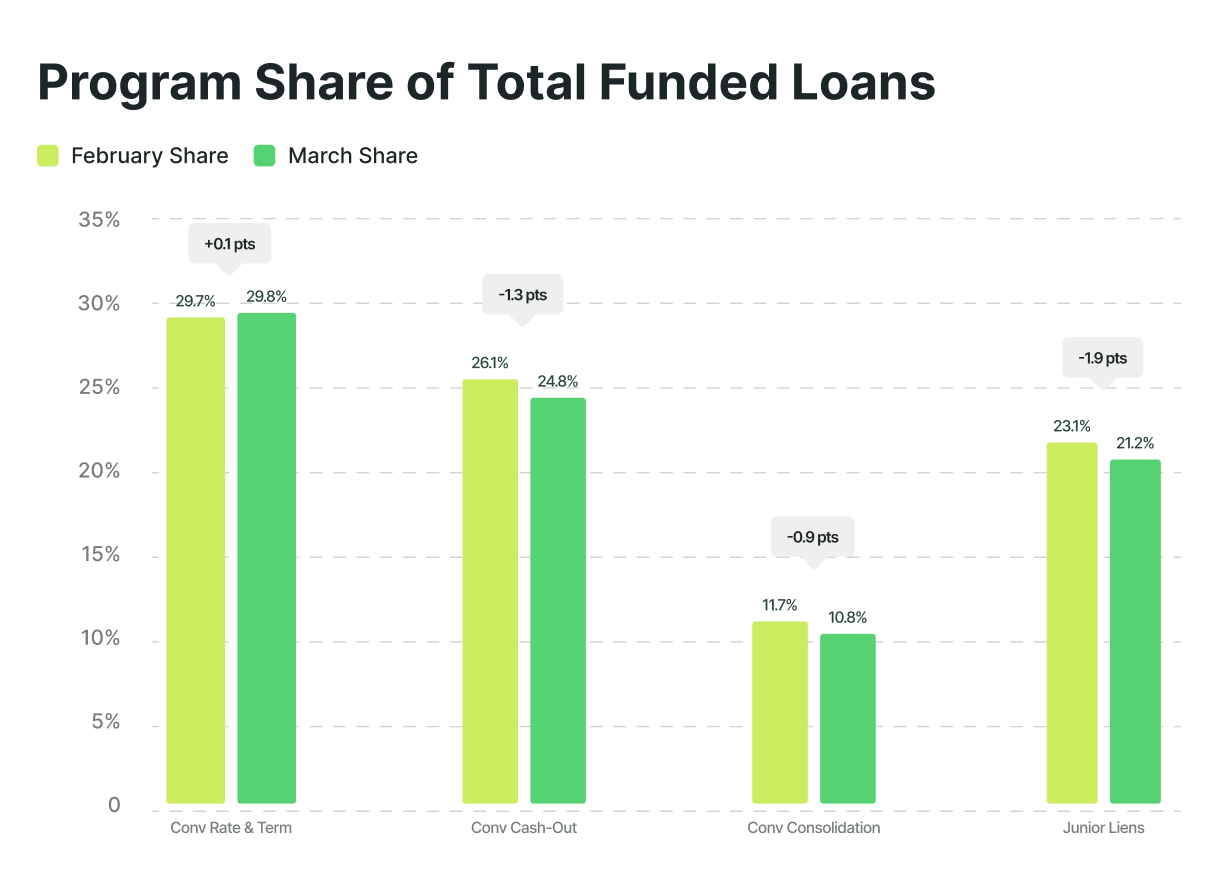
Application surveys measure intent. CoreLogic funded loan data measures reality — and the reality is that equity access continues to carry the refinance market. Cash-out activity dominates funded refi volume week after week, while rate-driven refinances (rate-and-term, streamlines, IRRRLs) remain a smaller slice of the market.
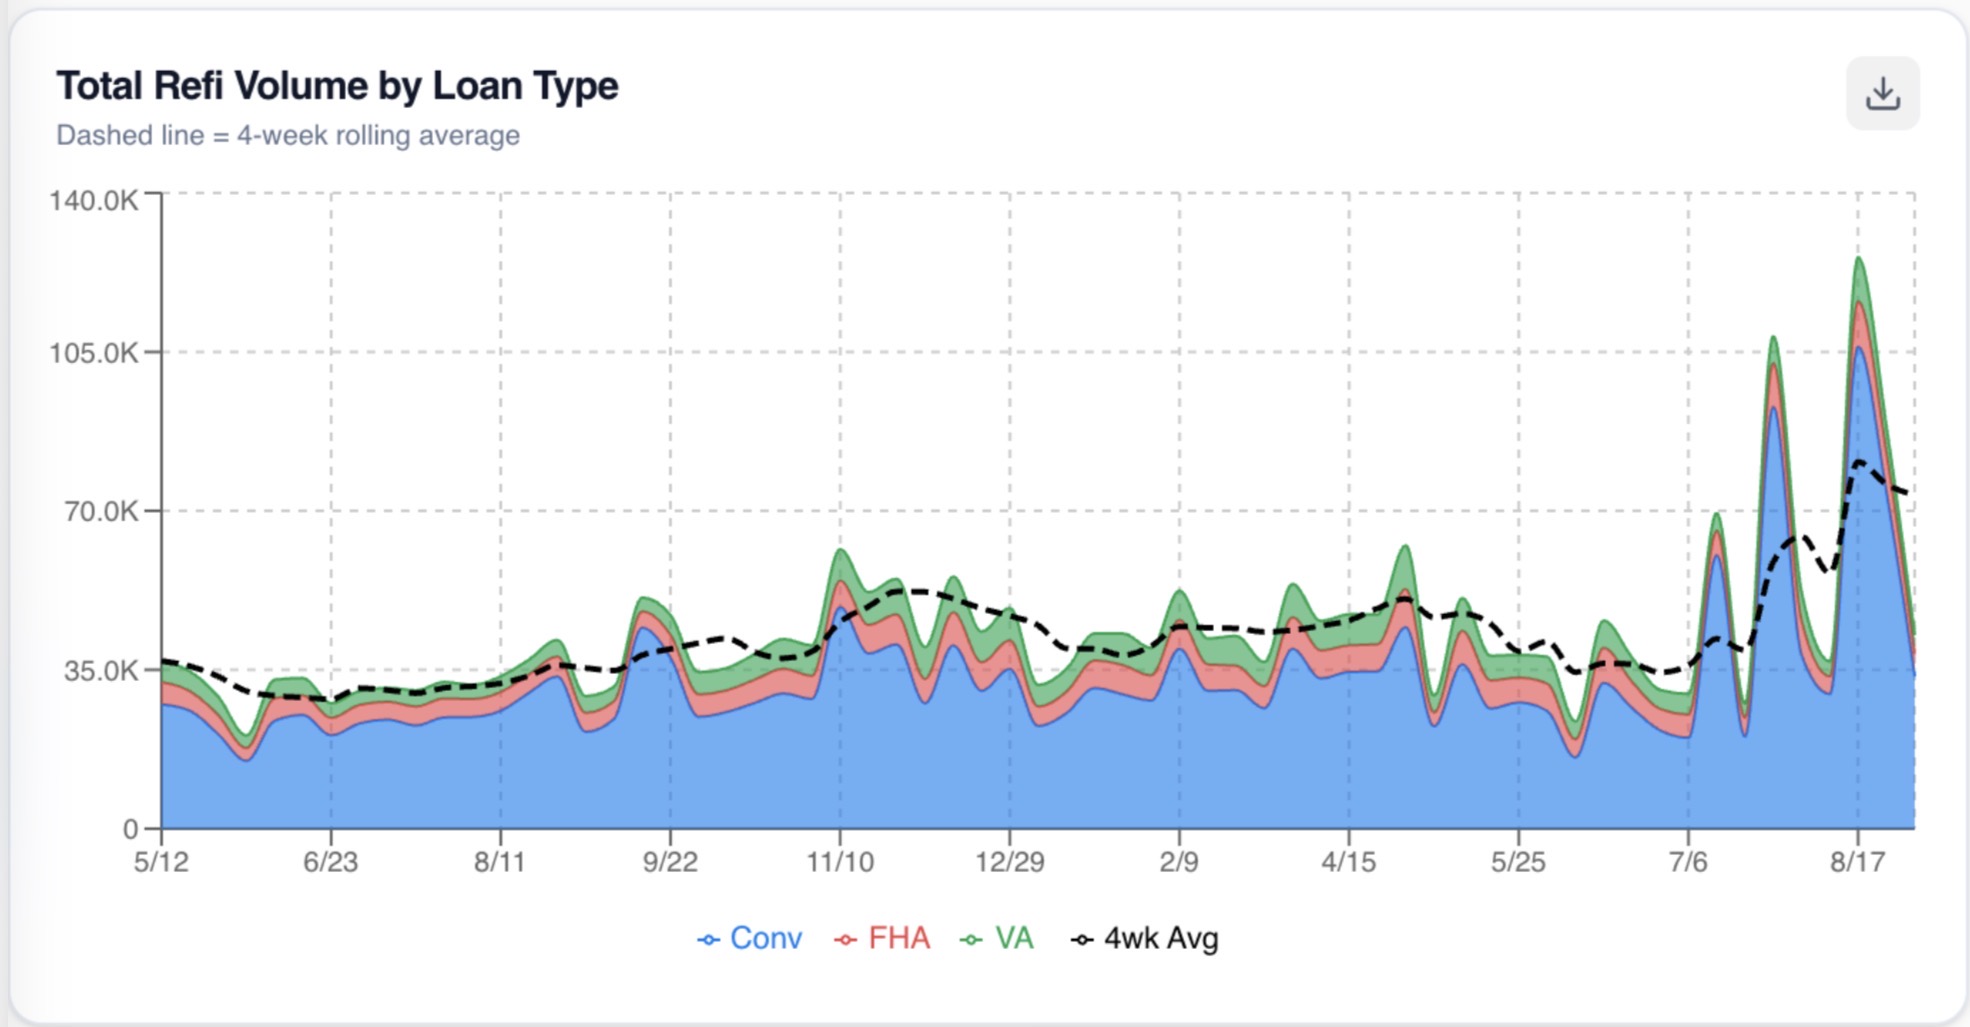
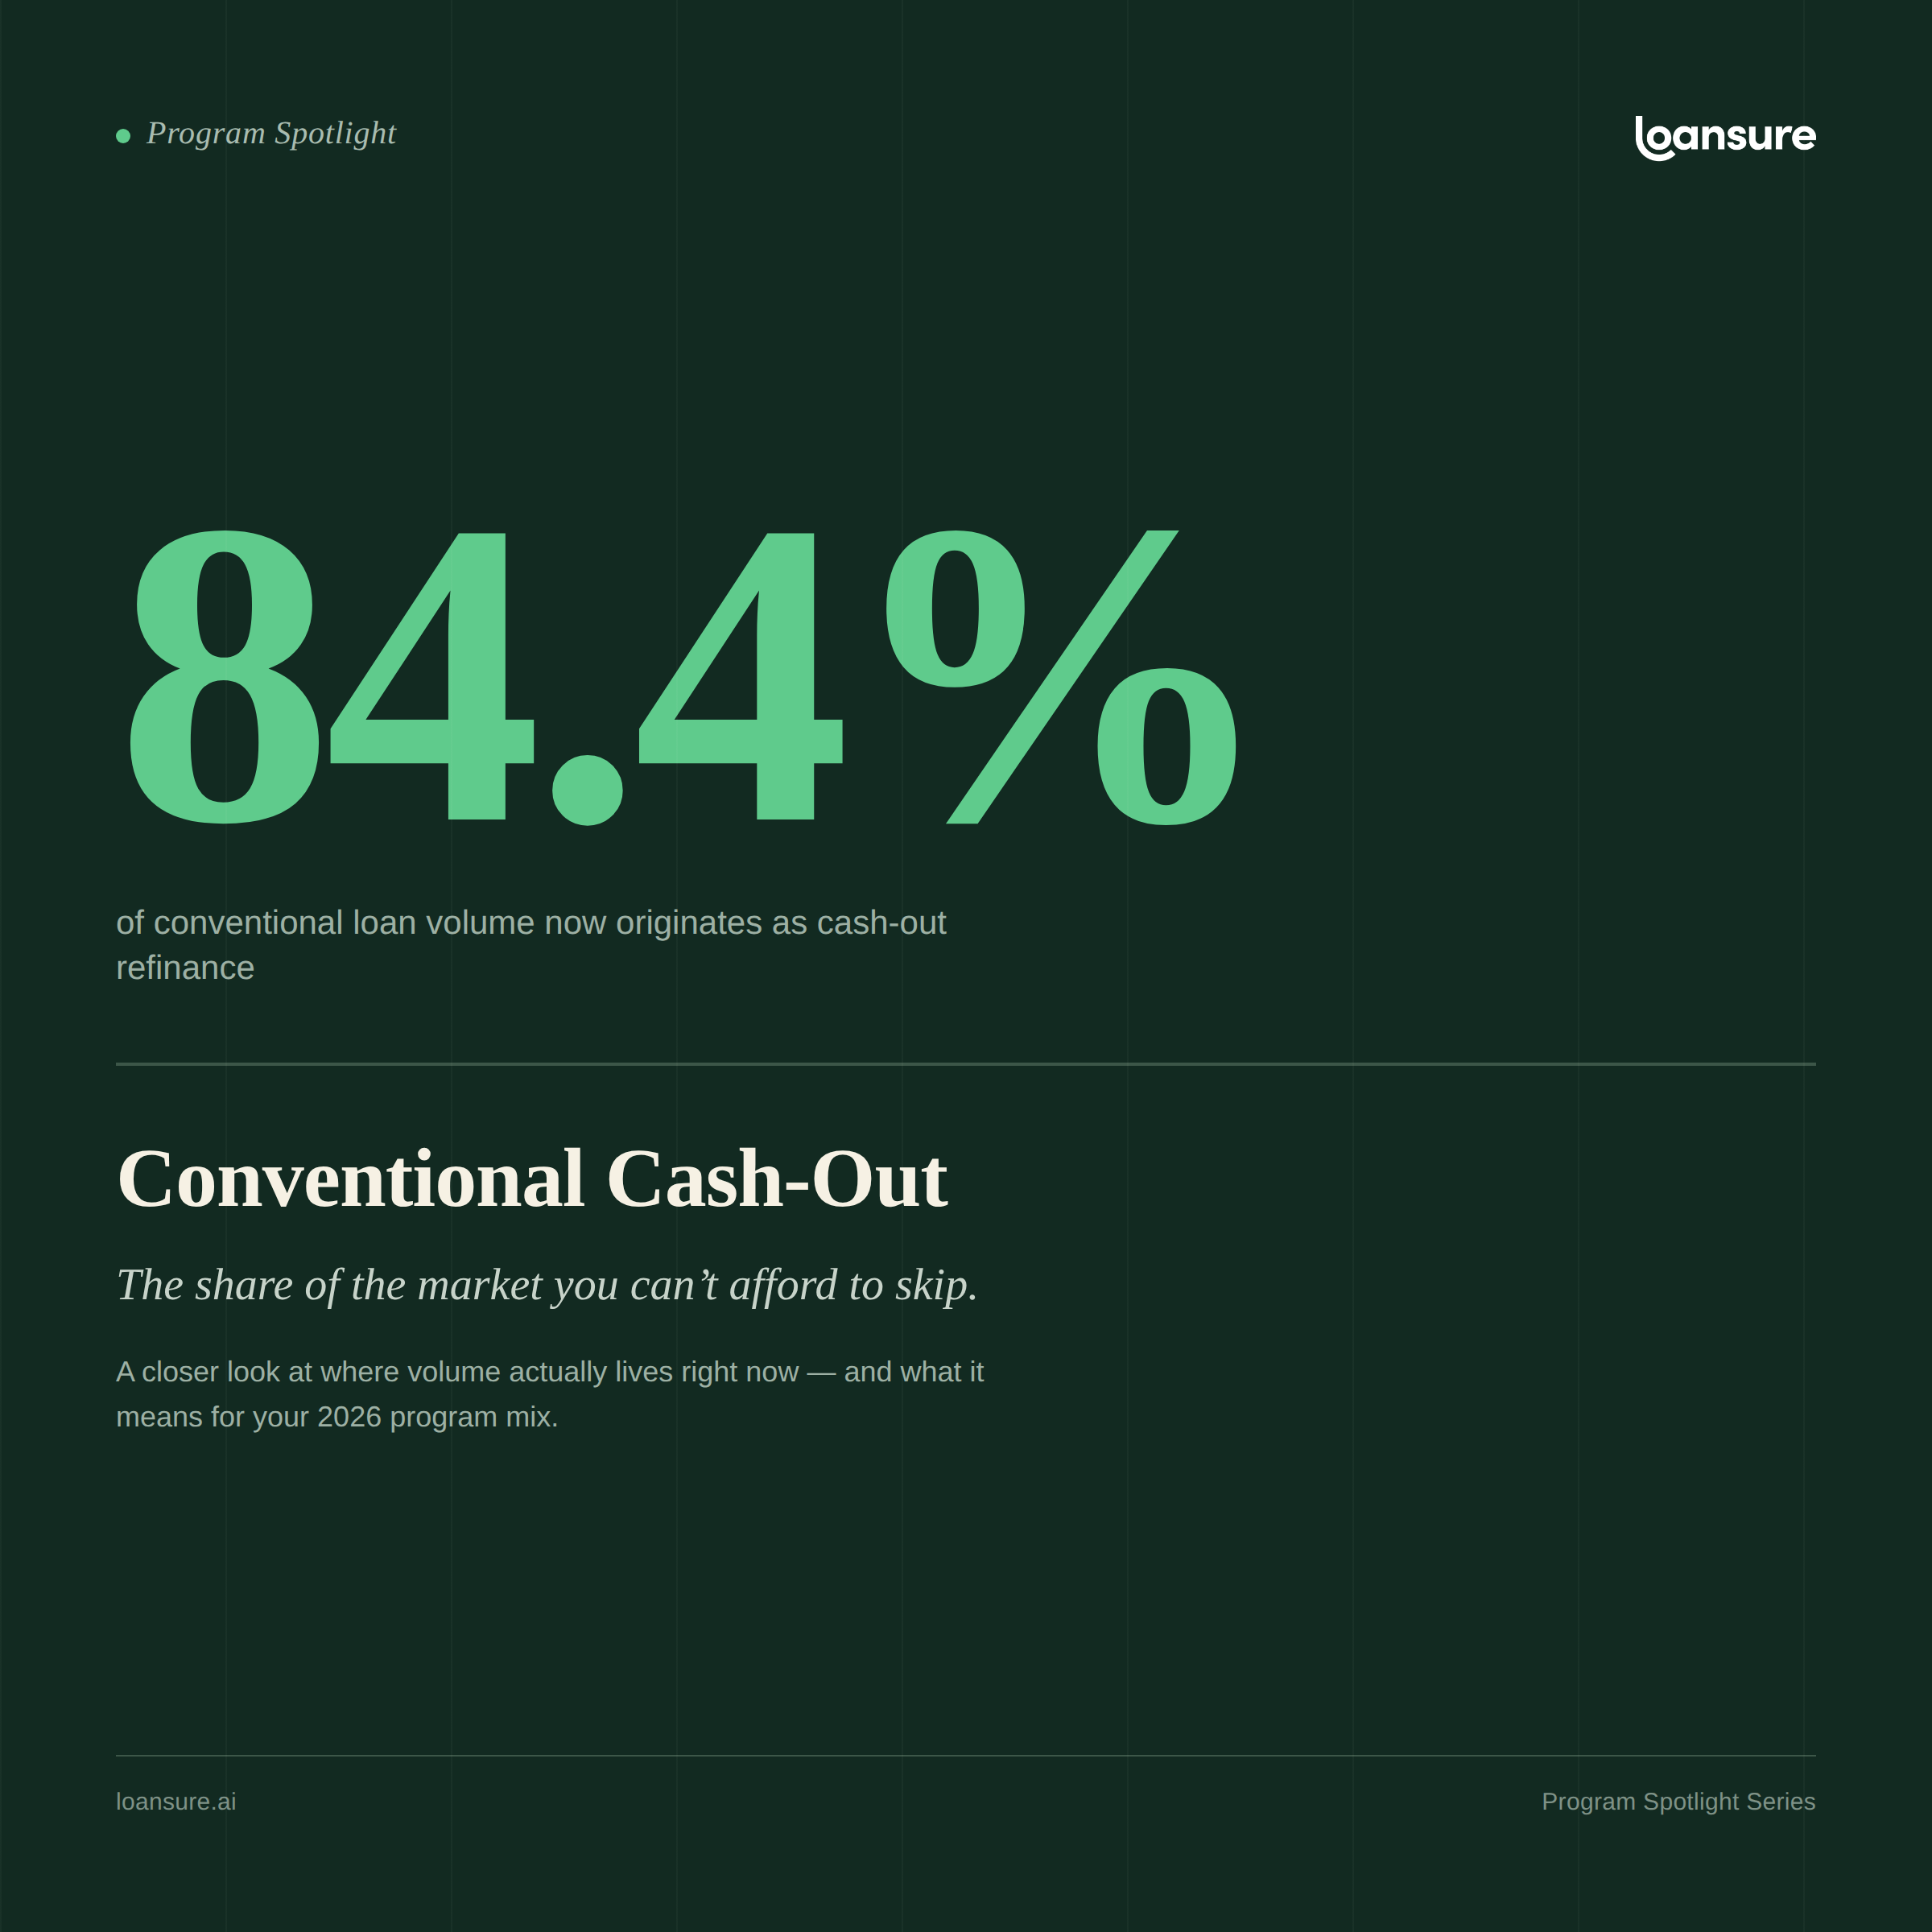
The standout number: conventional refinances now represent 84.4% of the total funded refi market. Not FHA. Not VA. Conventional — driven overwhelmingly by homeowners converting appreciation into liquidity.
That's consistent with the bigger structural picture we've written about all year: with more than 83% of mortgages locked in below 6.5%, the classic “lower my rate” borrower barely exists. What exists instead — in enormous numbers — is the homeowner sitting on years of appreciation, carrying record consumer debt at rates far above their mortgage, who needs access to capital more than they need a rate.
What This Means for Lenders
- Demand is selective, not absent. A 9.9% weekly drop in refi applications sounds bleak until you see that conventional refi is up year over year. Borrowers are responding — to the right offer, for the right reason.
- Equity access is the market. If your acquisition strategy is still weighted toward rate-reduction messaging, you're marketing to the 15% and ignoring the 84%.
- Stability rewards consistency. In a range-bound rate environment, the lenders who win are the ones in market every single week — building pipeline while competitors wait for a rate rally that isn't coming.
Want this data in your inbox every week instead of every month? Ask us about the Loansure Weekly Market Snapshot.
Loansure is the mortgage industry's Loan Acquisition System — homeowner-first, data-driven loan acquisition, from targeted outreach to funded outcomes. loansure.ai